 Help, Index & Glossary for
Protein Explorer (PE).
Help, Index & Glossary for
Protein Explorer (PE).
PE's Reference Manual.
(The only GREEN document in PE.)
by Eric Martz. Some entries contributed by Diana Ditmore.
Released April 2001 (~100 terms); continuously updated,
with major increments in June 2001 (~150 terms),
August 2001 (~200 terms), April 2004 (~270 terms).
This document is updated frequently, more often than is the downloadable
version of PE. If you can't find something, check on-line
at proteinexplorer.org,
for the very latest version of this document.
Can't find it? Please email suggestions for new entries
in this index/glossary (or for additional information under
existing entries) to
Eric Martz.
My goal is that the term you first think of should be here -- at least
as a cross reference to another entry!
If the term you want is not in the alphabetic list below, try your
web browser's Edit, Find (in document) to see if it occurs anywhere below.
Protein Explorer (PE) is designed to be, as much as possible,
self-explanatory.
PE's FrontDoor
has a wealth of introductory information.
Beginners wishing an introductory overview should start with the
1-Hour Tour.
When you don't know how to get the result you want, consult the
Help, Index & Glossary/PE Reference Manual
below -- it is always available
within PE by clicking
,
or through the PE Site Map,
or a link on the FrontDoor.
Throughout PE, most links to entries here are
colored green:
this is the
only green document
in PE.
See also the
Frequently Asked Questions (FAQ).
Finally, the
Tutorial provides a truly comprehensive tour.
Here are some
Tips & Techniques for using PE effectively.
Gale Rhodes (Univ. Southern Maine) has provided an excellent
Glossary of Terms from Crystallography, NMR, and Homology Modeling.
Teachers: See the Lesson Plans
and Assessment Questions.
Click on the first letter of the word you are looking for:
Top A B C D E F
G H I J K L M
N O P Q R S T
U V W X Y Z
Close
-
Acknowledgements
-
- Advanced Explorer
- Advanced Explorer links to a number of powerful control
panels and resources. Some of these require familiarity with the
command language.
To get to Advanced Explorer, look for the link
PE Site Map
in the current
control panel. You may have to scroll
the control panel up or down to find it.
There is also a
command to PE
that will take
you to Advanced Explorer:
enter the command .x
("x" preceded by a period).
- Aliases, command.
- Commands may be
entered as abbreviations called "aliases". For more information,
click the link Aliases below the message
box.
- Alignments.
- The term "Alignment" can refer either to alignments of sequences,
or of structures. For sequences, see MSA3D.
Instructions are also available for
making structural alignments.
- Amino acids
- The twenty standard amino acids are listed in the top frame of
the Sequences and Seq3D displays (available from the
PE Site Map),
or in QuickViews
with DISPLAY Sequences). Sequences are given in one-letter code,
but touching any letter shows its three letter code. For convenience,
the codes are also listed here. Mnemonic names are shown in quotations,
followed by the correctly spelled name in parentheses.
Ala A Alanine
Arg R aRginine
Asn N asparagiNe
Asp D "asparDic" (aspartic) acid
Cys C Cysteine
|
Gln Q "Quetamine" (glutamine)
Glu E "gluEtamic" (glutamic) acid
Gly G Glycine
His H Histidine
Ile I Isoleucine
|
Leu L Leucine
Lys K "liKesine" (lysine)
Met M Methionine
Phe F "Fenylalanine" (phenylalanine)
Pro P Proline
|
Ser S Serine
Thr T Threonine
Trp W tWyptophan (tryptophan)
Tyr Y tYrosine
Val V Valine
|
- Angles (simple, dihedral or torsion),
reporting with mouse clicks.
- In QuickViews, DISPLAY, Clicks,
then check Report angles or
Report dihedral (torsion) angles.
-
 Animations.
-
- For animations in PowerPoint
please see PowerPoint.
- Animations, movies, and morphs of conformational changes,
thermal motion, etc.
can be played in PE in a variety of renderings
and color schemes, rotated for viewing from any perspective,
and saved for playback outside of PE in Netscape or IE.
For details and examples, click on the animated image
of an EF hand near the
top of the FrontDoor, or go directly to
Animations in Protein Explorer.
-
PE also includes
instructions for making animated GIF files (also called
multi-GIF files) such as the ones shown here.
PE's
animation player automatically generates a script that can be
executed by RasMol
to save the frames for an animated GIF -- see
Making an Animated GIF with Protein Explorer.
If you know or have time to learn some of RasMol's
command language, you can save
other kinds of movements into animated GIFs, such as changes in the
axis of rotation and zooms.
Here are examples of
pausing
and zooming (be patient, there are pauses of several seconds),
changing
the axis of rotation,
morphing (case 1),
and
morphing (case 2).
- Assessment.
- See Student Assessment of Learning Gains
from Protein Explorer. See also
Visitors to the PE website.
- Asymmetric unit.
- See
Gale Rhodes'
Glossary of Terms from Crystallography, NMR, and Homology Modeling.
-
Atlas of macromolecules
- A browsable collection of PDB ID codes, with brief descriptions
of the molecules they represent. The
Atlas
is provided as a companion for
the molecular visualization
Lesson Plans.
- Atomic coordinate file
- See PDB file.
See also Axes, coordinate.
- Axes, coordinate.
- Each line in the PDB file that begins with "ATOM" gives the Cartesian
coordinates for one atom -- its position in space. The origin of this
coordinate system, and the directions of the axes, can be viewed by
entering the command set axes on.
(The background must be black).
Top A B C D E F
G H I J K L M
N O P Q R S T
U V W X Y Z
Close
- Back function.
- Sorry -- see UnDo.
- Backbone traces.
- For an explanation, go to FirstView
and click on backbone trace.
- Bare Explorer or Comparator
- "Bare" is an obsolete PE term. Please see
Empty PE.
- Bioinformatics
-
A brief definition of Bioinformatics that I like
is given by
Nilges and Linge (Institute Pasteur, France):
"Bioinformatics derives knowledge from computer analysis
of biological data".
It concerns large-volumes of biological information, recently
genomic sequences, gene expression data from microarrays,
protein-interactions, and three-dimensional ("3D") macromolecular
structure, but in a broader sense
includes various other sources such as clinical
trial data, neural networks, or the scientific literature.
Bioinformatics encompasses research with, and applications of
such information, as well as the development of the supporting
computational methods and tools.
Other definitions:
NIH;
bioinformatics.org.
See
Structural Bioinformatics,
Protein Structure Bioinformatics Resources
and
Protein Structure Literature.
- Biology Workbench
- The
Biology Workbench is
recommended for preparing multiple protein sequence alignments
for use in PE's MSA3D. The
MSA3D Tutorial (accessible from the MSA3D page within PE)
includes step by step instructions for this use of Biology Workbench.
- "Biomolecules"
- Specific oligomers and complete virus capsids
can be obtained with the link to
Probable Quaternary Structures in the
External Resources window (opened with
PE Site Map).
- Bonds.
- "Bonds" refers to bonds between atoms. Bonds may be either covalent
(strong) or noncovalent (weak). The latter include van der Waals interactions,
hydrogen bonds, and ionic bonds (such as salt bridges). PE
attempts to show covalent bonds as rods between atoms, when the molecule
is rendered in balls and sticks, or sticks. However, some strong bonds
may not be shown as rods (especially involving metals, or between
hetero atoms and protein or nucleic acid),
or occasionally bond rods may be shown where only noncovalent bonds exist.
Determination of the placement of bond rods is made by Chime.
For details, see
How Does
Chime Determine Covalent Bonds?
Noncovalent bonds can be visualized with the Contacts option
of the DISPLAY menu of QuickViews, or with
the Noncovalent Bond Finder accessible in
Advanced Explorer.
- Books about protein structure.
- See Protein Structure Literature.
- Boolean Logic (in QuickViews)
- "Boolean logic" means to apply logical operators to sets (of atoms).
For example, in the QuickViews Boolean section (scroll down in the
QuickViews control panel to find Boolean)
new selections can be and-ed with the previous selection (yielding the subset of atoms common
to both sets), or-ed ("+", adding atoms in either set), or subtracted (atoms in previously
selected set minus atoms in newly selected set). Similarly, display renderings
can be added ("+") or subtracted ("-")
from those already showing for the currently
selected atoms. For example, to a backbone display, you can add stick renderings
for sidechains of selected residues.
- Browser, web.
- The program used to retrieve hypertext information from the Internet
and display it, commonly
Internet Explorer or
Netscape Navigator.
PE works only inside a web browser, and requires
a web browser plugin called MDL Chime.
PE tests the client's web browser thoroughly
for compatibility before starting a session.
Top A B C D E F
G H I J K L M
N O P Q R S T
U V W X Y Z
Close
- Cation-pi interactions
-
The flat face of an aromatic ring has a partial negative
charge due to the pi orbitals.
Cationic sidechains (Asp, Glu) or sometimes ligands (including metal
ions) often
align themselves centered over the faces of aromatic rings.
Over one fourth of Trp's in the Protein
Data Bank interact with cations, and 99% of significant
cation-pi interactions occur within a distance of 6.0
Angstroms
(Gallivan
& Dougherty, 1999).
Cation-pi interactions make a significant contribution to the overall
stability of most proteins.
Gallivan and Dougherty conclude that "cation-pi interactions
should be considered alongside the more conventional hydrogen
bonds, salt bridges, and hydrophobic effects in any analysis of
protein structure".
Cation-pi interactions can be displayed in
QuickViews
(DISPLAY, Cation-pi), where they are explained in the center help frame.
Further information can be found in Advanced Explorer
under Cation-Pi Interactions, where there is an
Introduction, Gallery & Tutorial
for Cation-Pi Interactions.
- Chains
-
In PE, a "chain" is defined as any polymer
of amino acids or nucleotides (protein, DNA, or RNA).
Each chain has a one-character "name" (typically A, B, C, etc.).
Click on a chain to see its name reported in the
message box.
A list of all chains and their names is included in the
Sequences display, available
through the
PE Site Map.
Polymers of carbohydrates have no
backbone trace representation, and are not counted as chains, but rather
as hetero atoms ("ligand").
An introduction to the representations of chains
as backbone traces is linked to
FirstView.
See also
numbers for how to find out the total number of chains.
The number of chains reported by Chime's "show info" command
is usually incorrect, and is hidden in Protein Explorer.
- Charge of a protein.
- You can see the charge of a protein at any pH by using EMBL's
isoelectric point server.
- Chime
- Chime is a
web browser
plugin that renders the image of the molecule.
PE is, in simple terms, a user interface to Chime,
and is wholly dependent upon Chime.
PE benefits greatly from the chemical and protein intelligence
built into Chime. It is Chime that made it feasible for
me
to develop PE in a reasonable amount of time, working largely alone.
Chime works only on Windows and Macintosh, which limits
PE to these platforms, although
solutions are available for
other platforms, including linux, Irix, etc.
Chime is free, in part because it is built upon
RasMol. Chime was developed by
MDL Information Systems, Inc.,
largely by Tim Maffett, Bryan van Vliet, and Franklin Adler
(none of whom remain at MDL), and by Jean Holt and others.
Maffett deserves much of the credit for the design of Chime,
for retaining the macromolecular capabilities of RasMol (of little
interest to MDL), and for implementing many requests (not on MDL's agenda)
that
I
made.
Unfortunately, Chime's source code is not made available by MDL.
Chime is included in a commercial chemical database system,
ISIS, which is the main revenue-generating product of MDL.
Chime can be downloaded from
MDL's Chime Site.
See also the history of Chime.
- Chime's Menu
-
Chime has a built-in menu, distinct from the QuickViews
menus (and other menus) of PE.
It is unusual to need Chime's menu, and it is rather poorly organized
and contains no help. In the rare cases where it is useful,
the QuickViews help frame will direct you to use it. To access Chime's menu,
click on the MDL frank below and to the right of the molecule.
Some operations most easily accomplished with Chime's menu are
spotting missing amino acids,
listing the names of all ligand/hetero groups,
and
selecting all cases of one amino acid or nucleotide.
- Citation of PE
- See Literature about PE.
- Classroom use of macromolecular visualization.
- See Lesson Plans for Macromolecular Visualization.
- Coloring
- In order to color portions of a molecule in an arbitrary way,
you must first select the desired portions, and then apply a color.
For selecting, see selection methods.
To apply a color, you may use the COLOR menu in
QuickViews.
In addition to some complex color schemes,
it lists over a dozen plain colors at the bottom.
Be sure to read the help after picking
COLOR >Help<.
If you prefer,
you can enter commands. The best
way to learn commands is to watch the commands PE
sends to Chime after you use the COLOR
menu in QuickViews. Here are a few common examples.
Separate commands (e.g. select, then color) must be entered one at
a time (or delimited with semicolons ";").
- select 22-47:a then
color red to color residues 22-47 of chain A red.
- color [x204060] to color the selected atoms
with RGB (red green blue) hexadecimal values 20, 40, 60 (values range
from 0 to FF). This is the
same as
- color [32,64,96] where the RGB values
are given in decimal (0-255).
Here is a
complete guide to colors, including RGB values.
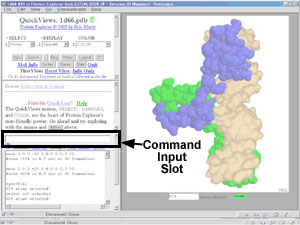
- Commands
- Protein Explorer and
Chime understand a superset of
RasMol
commands. Commands may be entered in the command slot
in the frame at the lower left, above the
message box.
A good way to learn commands it to watch the commands
QuickViews
sends to Chime, which are displayed in the message box,
and try entering variations of them directly.
PE includes a document
Using Commands, accessible
from
 near the
command input slot. There you will find links to the Command
Reference Manuals.
PE simplifies typing commands with its
command aliases.
near the
command input slot. There you will find links to the Command
Reference Manuals.
PE simplifies typing commands with its
command aliases.
- Comparative modeling
- See Comparative ("Homology") Modeling for
Beginners.
See also structural genomics.
- Comparator
- A alternate format of
PE that provides side-by-side comparison of two
molecules
(PDB files)
with all the same capabilities as
the one-molecule version of
PE.
Rotations with the mouse can be
synchronized.
Comparator can be invoked
empty, or by pre-specifying two molecules.
Links and examples are on the
FrontDoor.
It is also possible to set up a four-molecule comparison.
For details, see the fine print under "Manual Adjust" in
Window
Size Control in PE.
- Conservation
- See Evolution.
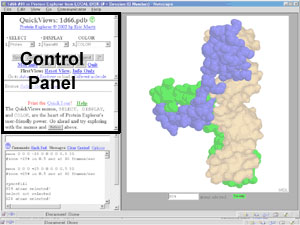 Control panel
- The panel (frame) at the upper left in the main (multiple-frame) PE window
containing buttons, menus, and links that
control the view of the molecule.
PE's Site Map provides an overview of its control
panels and enables easy navigation between them.
Examples of control panels
are
FirstView,
Features of the Molecule,
QuickViews,
Advanced Explorer,
and from Advanced Explorer,
MSA3D: Multiple Sequence
Alignment Coloring,
Cation-p Interactions/Salt Bridges.
- Cookies
- PE saves certain information between sessions on your computer.
This information includes your
preferences, and
the ten most recently loaded molecules
(in the Select previously loaded PDB file menu on the
Load Molecules
control panel).
The web browser's mechanism for saving such information is called "cookies"
for obscure reasons.
Here is more information about
cookies and cookie safety.
- Copyright:
- Please see PE Copyright.
- Corey, Pauling, Koltun (CPK).
- "CPK models" refers to physical, space-filling atomic models with atoms of
van der Waals radii, developed in the pre-computer era. These CPK
models also had a standard color scheme, similar to the "Element (CPK)"
color scheme used in RasMol, inherited by
Chime and hence by PE.
One difference is that carbon was usually black in physical models,
but is gray in PE. The CPK color scheme is incorporated into the
DRuMS system of standard color schemes.
- Counts of
atoms, bonds, chains, residues,
disulfide bonds, helices/strands/turns
- See numbers.
- CPK.
- See Corey, Pauling, Koltin.
- Crashing of Protein Explorer or your web browser.
-
Resizing PE's window size may cause it to crash --
please see resizing.
If your
web browser stops responding ("freezes"), or "crashes", close all web browser
windows
(on Macintosh, you must Quit from the application),
restart the web browser, and restart your PE session.
This usually corrects problems. On rare occasions, you may need to
reboot your computer to fix some strange behavior.
See also
Freezing
and
Tips & Techniques for using PE effectively.
Netscape and Chime were developed simultaneously, and each
has a few bugs that cause occasional problems. This is beyond our
control, but it rarely causes a problem more than once or twice a day,
even with PE sessions of several hours.
- Crystal contacts
- Intermolecular contacts that form as as result of
protein crystallization are distinguished from specific oligomer contacts.
Detailed information is available in the External Resources window
(accessed from PE's Site Map)
where you will find a link to
Crystal Contacts.
- Crystallography, X-ray
-
See
Nature of 3D Structural Data.
-
Cylinders,
- as a cartoon rendering of alpha helices,
are not available.
Top A B C D E F
G H I J K L M
N O P Q R S T
U V W X Y Z
Close
- Dates in PDB file headers
-
PE's Features of the Molecule
control panel displays a "deposition date" obtained from
the
PDB file header.
It is the date that the
atomic coordinates were deposited at the
Protein Data Bank. Other dates available in the header
may include revision dates on which the file was modified or
a new file was entered as well as the dates of publication
of literature references.
The Protein Data Bank's
Structure Explorer page also shows a "release date"
for each entry. This is the date the entry became publically available.
Authors sometimes deposit an entry subject to a "hold" condition
until a specified date, such as the date of journal publication.
- DeepView.
- DeepView, also known as SwissPDBViewer, is the best free modeling
software package available. It can dock two molecules,
structurally align two molecules,
mutate PDB files,
fill out unit cells and translate them using
crystal symmetry,
do
homology models and energy minimization. The results can be saved
as PDB files and explored in PE. DeepView and
related resources can be found under freeware at
molvisindex.org.
PE includes instructions for using DeepView to construct
crystal contacts.
The best introductions to how to use DeepView are by
Gale Rhodes.
- Disorder.
- See temperature value.
- Displaying PDB files (molecules).
-
- Distances between atoms, reporting with mouse clicks.
- In QuickViews, DISPLAY, Clicks,
then check Report distances (in Angstroms).
- Disulfide bonds
-
A disulfide bond is a covalent bond between the sulfur atoms in two
cysteine residues (reduced form), forming one cystine
(one oxidized
cysteine
dimer). Disulfide bonds may join
two peptide chains (an inter-chain disulfide bond) or two regions of the same
chain (an intra-chain disulfide bridge).
1KAL has intrachain disulfide bonds;
At the FrontDoor, the Quick-Start link to
the Antibody fab:lysozyme complex
(1FDL)
shows inter-chain disulfides.
Schematic diagrams of various renderings of disulfide bonds are
available from a link at FirstView. For
counts of disulfide bonds, see numbers.
- Docking two molecules.
-
It is not possible to load multiple PDB files
into
Chime, nor move molecules relative to each other in a single
Chime image. This can be simulated, laboriously, with
animations of multiple-model ensembles in
NMR format. Two molecules can be displayed side by side
in Protein Comparator, and moved
together in synchrony or independently.
Two molecules can be aligned and displayed
together, but cannot be moved relative to each other.
It is possible to move molecules relative to each other
in DeepView or
Berkeley-RasMol.
- Double molecule.
- See multiple molecules.
- Downloading
-
- Driscoll, Timothy
- Author of the Script Recorder (under development) for Protein
Explorer. Also authored the Chime shell and much
of the content for the Biochemistry
in 3D website for Lehninger's Principles of Biochemstry, and
for
Stryer's Biochemstry. See also DRuMS, the
system of color schemes used in PE.
Founder of MolVisions.Com.
- DRuMS.
- A system of standard color schemes for macromolecular
visualization used in PE,
documented by Tim Driscoll
in collaboration with Frieda Reichsman. See
the DRuMS Website.
Top A B C D E F
G H I J K L M
N O P Q R S T
U V W X Y Z
Close
- Electrostatic potential
- See molecular electrostatic potential.
- "Empty" Explorer or Comparator
- Starting
PE "empty" means starting it before
you tell it what molecule to display.
When started
"empty",
PE shows its "Load Molecule"
control panel, which offers several
ways to load molecules.
There, the last ten molecules loaded can be re-loaded from
a pick list.
You can start either Protein Explorer or Protein
Comparator
"empty"
from PE's FrontDoor.
 Entering a command.
- Commands (or command
aliases)
may be typed in the slot
that says "# Commands May Be Entered Here". Pressing the Enter
key will then execute the command.
- Errors
- See Troubleshooting.
- Evaluation.
- See Assessment.
- Evolution
- Multiple sequence alignments can reveal patches on
a protein surface that are conserved to maintain their functions.
The easiest and most sophisticated method to visualize
conserved surface patches is with the
ConSurf Server.
Prior to the release of ConSurf, PE offered
MSA3D, which remains available.
- Experimental Method
- There are several types of experimental data upon which
the model in a PDB file can be based. Three principal
categories are X-ray crystallography,
NMR, and
theoretical models
(including comparative models).
See also
Nature of 3D Structural Data.
- Expert Mode
- In the
Preferences, if you check Expert,
FirstView will not be shown unless requested,
and in general less help and fewer alerts/warnings will be displayed.
A
complete list of all the effects of enabling Expert Mode
is available.
Top A B C D E F
G H I J K L M
N O P Q R S T
U V W X Y Z
Close
- FAQ
- Frequently Asked Questions,
see PE's FAQ.
- "Features of the Molecule" control panel
-
PE's
Features of the Molecule
control panel
displays information extracted from the
PDB file header.
Important information
provided by the author(s) of the model is displayed in a more accessible format,
with one-click visualization of author-designated substructures,
and a link for displaying the complete header text.
To get to Features of the Molecule
from another control panel, look for the link
PE Site Map
in the current
control panel. You may have to scroll
the control panel up or down to find it.
- Fewer chains
- Methods for eliminating some of the chains from your PDB file
are explained in the link to Fewer or Single Chains
in the External Resources list
(accessed from PE's Site Map).
- FirstView
- The
control panel
titled FirstView describes the first view of a
molecule offered by PE.
You'll arrive at FirstView automatically whenever you start PE,
unless you have checked
Expert
in
Preferences.
To get to FirstView from another control panel, look for the link
PE Site Map
in the current
control panel. You may have to scroll
the control panel up or down to find it.
FirstView introduces
- Free R
- Free R is a statistical quantity introduced in 1992 by
Axel T. Brünger to assess the
quality of a model
from X-ray crystallographic data. It is calculated in the same
manner as the R value, but from a subset
of the data set aside for the calculation of free R, and
not used in the refinement of the model. It is a more reliable
tool for assessing the model than the R value because it is not
self-referential -- that is, as an estimation of errors, free R is free of any bias that may have been
introduced during refinement. As a rule of thumb, free R should
not exceed the R value by more than 0.05; that is, if the R value is 0.20,
free R should not significantly exceed 0.25. Free R values exceeding
0.40 raise serious doubts about the model.
See also
Quality of the molecular model.
- Freezing of your computer, PE, or your web browser
- If your computer gets very slow while you are using
PE,
see if you have PE sessions (windows) in the background with
spinning molecules. Spinning several molecules at once will
make your computer very slow, even if you can't see them.
Turn off unnecessary spinning, and close PE sessions you don't need.
See also Crashing
and
Tips & Techniques for using PE effectively.
Macintosh: Make sure you have given Netscape adequate
memory -- see
Troubleshooting.
- FrontDoor
- The first page you see when you go to
www.proteinexplorer.org.
Links that start PE by pre-specifying a molecule skip the FrontDoor.
The
FrontDoor provides numerous methods for entering PE, information about PE,
and links to other Chime resources.
Top A B C D E F
G H I J K L M
N O P Q R S T
U V W X Y Z
Close
- Gaps.
- See missing residues.
- Gzipping PDB files
- PDB files that are put on a server to be displayed in Chime or
Protein Explorer should be gzipped. This reduces their size about
3.5-fold, and the time required to transfer them through the
Internet is reduced in proportion. Chime unzips these files
automatically and does not take a noticeable
time to do so. (If you want your files to be readable by RasMol
directly from the server, you should not gzip them, because RasMol
does not understand gzipped PDB files. However, if the gzipped file is first
displayed in Chime from the server, and then
saved from Chime, Chime saves an unzipped
version of the file readable by RasMol.)
Here are
instructions for gzipping, including the program to do it.
Please note that the gzipped format is not the same as some other
common data compression formats, such as WinZip. Chime cannot
decode a WinZipped file unless it is first decompressed by WinZip.
Top A B C D E F
G H I J K L M
N O P Q R S T
U V W X Y Z
Close
- Header (of PDB file)
- The PDB file header is a block of text at the
beginning of the PDB file
that precedes the atomic coordinates.
The header contains information deemed important by
the authors of the PDB file, including
the original literature citation,
full names of ligands, optionally residues constituting
various functional sites, etc.
This information is accessible in
PE's
Features of the Molecule control panel.
- Hetero atoms
- "Hetero" is a term defined in the PDB file format, and inherited
by Chime and PE.
It denotes all atoms that are not included in chains of protein
or nucleic acid. Thus, hetero atoms include
ligands, solvent, metal ions,
and all carbohydrate moieties. Hetero atoms may or may not be
covalently bound to chains of protein or nucleic acid.
Nonstandard amino acids and nucleotides will display as hetero atoms.
More information on "hetero atoms" is
available at FirstView, and in QuickViews
under SELECT Ligand, or SELECT Solvent.
- Hiding portions of the molecule
- The following strategies can be used in QuickViews
to hide portions of the molecule.
- Use the SELECT menu to select what you want to see
(or see selection methods). Then
DISPLAY Only.
- Select something you want to hide, then
DISPLAY Hide. You will be presented with a menu of
possible things to hide, including hide everything.
- This is more cumbersome than DISPLAY Only,
but you might
like to know that after selecting what you want to see, you could
SELECT Invert, then
DISPLAY Hide.
-
Note that DISPLAY Hide offers
hide everything, but if you like
commands, enter restrict none
(or the alias rn)
to hide everything. If anything remains visible, it can be
hidden with options available on DISPLAY Hide,
and you can then observe the relevant commands as they are
displayed in the message box.
See also Fewer or single chains.
- History.
- For the history of PE, see
Purpose of the Protein Explorer,
PE's Web Browser Testing mechanisms,
RasMol, and
Publications about PE.
Also available are a
History of Visualization of Biological Macromolecules,
the
Earliest Solutions for Macromolecular Crystal Structures,
and
Protein Structure Literature.
- Hits to the PE website
- See Visitors.
- Homology modeling
(synonomous with "comparative modeling")
- See Homology modeling for beginners.
See also structural genomics.
- Hyperlinks to PE
- It is easy to make a hyperlink that starts PE
and automatically displays the desired molecule.
- On-line: http://molvis.sdsc.edu/protexpl/pe.htm?id=xxxx
where "xxxx" is the PDB ID code for the molecule desired.
- Off-line/local files:
Let's assume you have
downloaded and installed PE in c:\chime\pe2.0,
and you have also
downloaded a PDB file and saved it in c:\pdbs\1d66.pdb.
This hyperlink will start PE and display the molecule:
file:///c|/chime/pe2.0/pe.htm?id=file%3A///c|/pdbs/1d66.pdb
Complete instructions
are linked to PE's FrontDoor.
- HTML
- HyperText Markup Language. The language that specifies how text will
be formatted and displayed in a web browser, such as Netscape or Internet Explorer.
PE is built with HTML
and javascript.
- Hydrogen atoms (and water)
- Click on Water, and from there on
more about hydrogen,
starting from FirstView.
Or here is a direct link to
more about hydrogen.
You can add hydrogen atoms to a molecule lacking them
by using Gert Vriend's
WHATIF WWW Interface.
- Under Server Classes (at left) click "Hydrogen (bonds)".
- Select "Add protons to structure".
- Enter your PDB ID or upload a coordinate file.
- After the results appear, click on the pdb link to receive the coordinate file containing added hydrogens.
You can also use Chime itself to add hydrogen atoms to protein
(but not nucleic acid, ligand, or solvent) -- but you
cannot save them to a PDB file. Open Chime's
menu, and select Options, Sprout Hydrogens. Next, you will
need to select them (in
QuickViews, SELECT Hydrogen, or SELECT
All) and display them. Beware: Chime has been known to make some mistakes
in where it puts the hydrogen atoms. Again, using Chime's menu for "File,
Save molecule as" will save a PDB file but it will not include these hydrogens.
Use WHATIF (above) if you need to save the hydrogen-decorated PDB file.
- Hydrogen bonds.
|
Typical hydrogen bond
within a protein.
|
-
Hydrogen bonds occur when a "donor" atom donates its covalently
bonded hydrogen atom to an electronegative "acceptor" atom.
The oxygen in -OH (e.g. Ser, Thr, Tyr), HOH, and the nitrogen in -NH3+
(as in Lys, Arg) or
-NH- (as in the main chain peptide bond, Trp, His, Arg, nucleotide bases)
are typical donors.
The lone electron pairs on these same donors can serve as hbond acceptor
sites. So can those on carbonyl oxygens =O (as in the main chain)
or nitrogens with three covalent bonds =N- (as in His, Trp, or nucleotide
bases). Lacking hydrogens, these latter cannot serve as donors.
Jeffrey categorizes hbonds with donor-acceptor
distances of 2.2-2.5 Å as "strong, mostly covalent", 2.5-3.2 Å
as "moderate, mostly electrostatic", 3.2-4.0 Å as "weak, electrostatic" (page 12).
Energies are given as 40-14, 15-4, and <4 kcal/mol respectively.
Most hbonds in proteins are in the moderate category, strong hbonds requiring
moieties or conditions that are rare within proteins. The hydrogen atoms
in moderate hbonds often do not lie on the straight line connecting the
donor to acceptor, so donor-acceptor distance slightly underestimates the
length of the hbone (Jeffrey, p. 14). The mean donor-acceptor distances
in protein secondary structure elements are close to 3.0 Å, as are
those between bases in Watson-Crick pairing (Jeffrey,
pp. 191, 200).
Since many PDB files
lack hydrogen atoms, the presence of an energetically
significant hydrogen bond can be inferred
when a probable donor and acceptor are within 3.5 Å of each other.
PE's
DISPLAY Contacts defines "likely noncovalently bonded"
oxygens and nitrogens (shown as balls) as those within 3.5 Å of
other oxygens and nitrogens.
At present, PE can display as rods connecting atoms
only two subsets of hydrogen
bonds: protein backbone-to-backbone hbonds within chains (but not between
chains), and Watson-Crick hbonds between DNA base pairs.
These can be shown in QuickViews: DISPLAY Hbonds,
where further information will be shown automatically.
PE presently has no built-in routines to show hbonds between backbone
and sidechain, backbone and water, sidechain and sidechain, sidechain and water,
protein and ligand, protein and nucleic acid,
non-canonical hbonds in DNA or RNA, etc. However, manual methods are available
to show
arbitrary bonds.
Top A B C D E F
G H I J K L M
N O P Q R S T
U V W X Y Z
Close
- Internet Explorer (IE)
(trademark of Microsoft Corporation)
-
PE works better in
Netscape than in IE --
here are the known
differences.
Prior to 2002, PE worked only in the
Netscape web browser.
In
version 1.91 Beta, PE was adapted to work in either web browser,
with the help of Paul Pillot
and Jean-Philippe Demers
(see
Protein Explorer's Web Browser Testing
for
Microsoft's Internet Explorer
and Netscape Communicator
and
Protein Explorer's Implementation
in Microsoft's Internet Explorer).
See also Tips & Techniques for IE-specific
tips. (These IE-specific tips display only if you are using IE).
If you are having problems getting PE to work in IE, see
Troubleshooting.
- Irix
- Protein Explorer works well in a
Microsoft Windows window
on SGI/Irix supported by Citrix Metaframe.
- Isoelectric point of a protein.
- The isoelectric point, or pI, is the pH at which a protein has zero
net charge. When the pH is higher than the isoelectric point,
the protein has negative charge, and when lower, positive charge.
You can calculate the isoelectric point of your protein easily using
on-line resources.
- First, get the one-letter amino acid sequence of your protein.
Use PE's Site Map, External Resources to open
PDB's Structure Explorer from RCSB. There click on the link
(at the left) Sequence Details, and on that page, click
on Download all chains in FASTA format. Block the sequence of the chain
of interest (excluding the comment line beginning >) and copy it to the
clipboard.
- Second, go to the
EMBL WWW Gateway to Isoelectric Point Service, paste your sequence
in the box, and press the button.
- Warning: the sequence you paste in must be in UPPER CASE one letter
code. If you paste in a lower case sequence, you'll get pI = 6.014999, which
is for the backbone only, because it doesn't recognize lower case amino
acids!
Top A B C D E F
G H I J K L M
N O P Q R S T
U V W X Y Z
Close
- Javascript
- The programming language with which
PE is built, along with
HTML.
Javascript is a programming language that works only within the web
browser.
Javascript is interpreted by the web browser.
Basically, it adds programming capability to
HTML documents. Javascript should not be confused
with java, a general-purpose, cross-platform programming language.
In PE, javascript controls
Chime by sending it
commands.
PE comprises over 40,000 lines of
HTML plus javascript.
- Javascript error(s)
-
Javascript errors should not occur when running
PE, unless you do not have
Chime configured properly.
In that case, you will never see any molecule in PE, and you
need to consult Troubleshooting.
If you are using a Mac PPC, and you have been unable to get PE to display
a molecule, and you are getting this javascript error:
top-fr_chime.document.form_chime.chime_graphics01 has no properties
you can fix it by following the troubleshooting procedure
Enabling Chime in Macintosh.
If Protein Explorer did show you a molecule, and then during the session
a javascript error occurred,
the most likely reason is
that Netscape or Chime has become unstable or unreliable. This may happen
occasionally while using Protein Explorer and it is usually not your fault
(but see Tips and Techniques for using PE Effectively).
The solution is simply to close all your web browser windows (on Macintosh, use the
File menu to Quit), wait a few seconds, and then restart your web browser and begin
a new session of PE. If that doesn't prevent the javascript error, try
rebooting your computer. If you get a javascript error reproducibly after the
same action,
despite restarting your web browser and rebooting, you have found a bug that should
be reported. Diagnosis is best done in Netscape rather than Internet Explorer.
Type "javascript:" (including the colon) in the location slot
of Netscape, and copy the error report into an email. Describe in detail
what version of PE you are using, and what actions induced the error.
Send the report to yours truly.
- Journal articles
- See Literature about PE
or Protein Structure Literature.
Top A B C D E F
G H I J K L M
N O P Q R S T
U V W X Y Z
Close
Top A B C D E F
G H I J K L M
N O P Q R S T
U V W X Y Z
Close
- Labels, adding with mouse clicks.
- In QuickViews, DISPLAY, Clicks,
then check Display labels on atoms.
- Lesson plans.
- See Lesson Plans for Macromolecular Visualization.
- Ligand.
- In general, "ligand" usually means a small molecule
specifically bound to a macromolecule
by noncovalent bonds. In Chime and
PE, "ligand" has a somewhat different definition:
all hetero atoms that are not
solvent.
"Ligand" in this PE sense may be noncovalently or covalently bound to
non-hetero atoms, namely chains of protein or nucleic acid.
For example, both a noncovalently-bound enzyme inhibitor, and
an asparagine-linked (covalently bound) carbohydrate adduct qualify
as "ligands" in PE. On the other hand, a single standard nucleotide (A, C, G,
T, or U) bound to a protein noncovalently does not fall under the term "ligand"
as defined within Chime and thus PE, even though it would be considered
"ligand" in the more usual, general sense.
Moreover, nonstandard amino acids or nucleotides, despite being
in protein or nucleic acid chains, will display as "ligand" in PE.
In
QuickViews, pressing the [Ligand] button shows a short definition
and explanation.
You can conveniently list the names of all ligand groups present in your structure
with Chime's Menu: Select, Residue. In the resulting
submenu, following the 20 amino acids, are listed all ligand (hetero)
group names (limited to 1-3 characters in length).
- Limitations.
-
The following limitations exist in Protein Explorer:
- Links to PE
- See hyperlinks.
- linux
- Protein Explorer works well in a
Windows subsystem
running under linux.
- Literature
- See Literature about PE
or Protein Structure Literature.
- Load Molecules
- PE's
Load Molecules
control panel allows molecules to be loaded
from downloaded PDB files saved to the local disk (press the [Browse] button),
from the Protein Data Bank via Internet if you know the
PDB identification code, or from a menu
of the most recently loaded molecules. To get to the Load Molecules
control panel, from the
FrontDoor, enter
Empty Explorer, and it will appear automatically.
Alternatively, from within a PE session, use the
PE Site Map
link for
New Molecule.
Finally, from anyplace in PE, enter .l (period plus lower case "L", no space
between) in the command entry slot.
See also Displaying PDB files.
Top A B C D E F
G H I J K L M
N O P Q R S T
U V W X Y Z
Close
- Maffett, Tim.
- See Chime.
- Martz, Eric.
- Principal architect and author of PE. Ph.D. 1969 in biology
-- until 1997, an immunologist and
cell biologist. See his
personal page. Self-taught programmer, who (prior to his involvement
in molecular visualization beginning in 1995) wrote the first personal
bibliographic management system (Bibliofile, 1981-1991, later known as Document
Management System for Citations, no longer on the market),
and MFI (1992-1995), a
freeware data analysis program for flow cytometry.
- Menus
- In PE, the menu system is
QuickViews. There is also a (rarely needed)
menu built into Chime.
- MEP
- See molecular electrostatic potential.
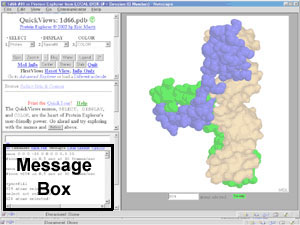 Message Box.
- A white box in the lower left frame
of PE.
The identities of atoms clicked with the mouse are reported here as messages,
as are counts of atoms selected and options such as distances or angles
between atoms.
When you press buttons or use menus
in the
control panel,
commands are generated automatically by PE and sent to
Chime. These commands are shown in the
message box, along with other messages from PE or Chime, such as the
selected atom count after a "select" command.
- Method, experimental
- See Experimental Method.
- Missing amino acids.
- Here is an easy way to find out whether all 20 amino acids are
present in your structure. Using Chime's menu,
Select, Residue. On the resulting submenu, all 20 amino acids are listed.
If any are not present, they are gray instead of black.
- Missing residues.
-
Some residues present in the crystal may be missing, leaving "gaps". Perhaps
they
were not assigned coordinates because their
disorder (or "temperature") was too high in the crystal. This is often
the case for the ends of chains, or extended surface loops.
For more information about possible reasons for gaps or missing residues,
open
PE's Site Map, and then
either Sequences or Seq3D. This will open a sequence
display window, where you will find links to Help about missing
residues.
- Modeling, molecular.
- "Molecular modeling" means creating models of molecules,
either from
experimental data or
theory.
The resulting "model" is an atomic coordinate file.
"Modeling" also means changing the positions or bonding relationships
of atoms in existing models, such as by energy
minimization, molecular dynamics, etc. "Modeling" is distinct from "molecular
visualization" which, strictly speaking, means looking at a structure
without modifying it. The best freeware package for macromolecular
modeling is DeepView.
See also mutation,
model quality,
and
homology modeling.
- Model quality
- See
Quality, Model.
- Models, multiple
- See
multiple models.
- Molecules, displaying & exploring
-
See Displaying PDB Files.
- Molecule name
- Available PE's Features of the Molecule
control panel.
- Molecular electrostatic potential
- "Molecular electrostatic potential" (MEP) refers to the distribution of
electrostatic charges (including partial charges) in a molecule. Most
often, it is displayed on a solvent-accessible surface
of the molecule, as a color scheme (red negative, blue positive, following
CPK). Advanced Explorer has a
link to Surfaces, where you can apply various MEP color schemes.
However, if you plan to use MEP very often, see the
Comparision of MEP Renderings for a better solution.
- Molecule Information Window
- This window ceased to exist with PE version 2.1 in July, 2003.
It is superceded by two resources:
the Features of the Molecule
control panel, and the
External Resources window which can be opened from
PE's Site Map.
- Monitor lines, showing distances between atoms,
inserting with mouse clicks.
- In QuickViews, DISPLAY, Clicks,
then check Display monitor lines between pairs of atoms.
- Morphs.
- See Animations.
- Mouse controls.
-
See
- Movies.
- See Animations.
- MSA3D
- "
Multiple Sequence Alignment 3D" is a feature within PE
that can color a 3D protein to show regions of conservation or mutation
based on a multiple protein sequence alignment. As of December, 2001,
it has been superceded by the
ConSurf Server,
a more sophisticated and automated way to visualize conserved
surface patches on 3D protein structures.
MSA3D is accessed from
Advanced Explorer.
- Multiple models (in a single PDB file).
-
Multiple models (molecules) can be included in a single
PDB file,
and displayed in
PE, if they are in NMR format.
QuickViews displays only the first model.
To see other models,
from Advanced Explorer, click on the link to
NMR Models/Animation.
PE can play the models as a movie,
or examine them one at a time, or in selected subsets.
- Multiple molecules (multiple PDB files).
-
See
Protein Comparator
and
docking.
- Multiple Sequence Alignment
- See MSA3D.
- Mutation.
- "Mutation" means changing one or more amino acids or
nucleotides in a protein or nucleic acid chain.
Top A B C D E F
G H I J K L M
N O P Q R S T
U V W X Y Z
Close
- Name of molecule
- Available PE's Features of the Molecule
control panel.
- Netscape Communicator/Navigator
(trademark of Netscape Corporation)
-
PE works better in
Netscape than in Internet Explorer --
here are the known
differences.
Netscape is the web browser that defined the plugin, and
LiveConnect, a protocol for communication between the web browser and the
plugin.
Chime was developed for Netscape at a time when
Netscape was used by the majority of people (1995-8).
PE was developed in Netscape, and
from its first release
(version 0.9 in October 1998)
through 2001,
PE worked only in Netscape. Because
Internet Explorer (IE)
became the predominant web browser by the new millenium,
PE was adapted to work in IE late in 2001,
with the help of Paul Pillot
and Jean-Philippe Demers
(see
Protein Explorer's Web Browser Testing
for
Microsoft's Internet Explorer
and Netscape Communicator).
- Network error
- If the FrontDoor of PE
changes to "Network error. Unable to request URL from host ...",
and the host URL includes "sitemeter", this means two things.
First, either you are not connected to the Internet, or the
SiteMeter server is down.
Second, the only time
I have seen this message is when a software package called
AdSubtract is installed.
Disabling AdSubtract does not prevent this behavior -- you must
uninstall it to prevent this. If this is a problem for you,
please contact me.
If I receive requests, I'll modify the FrontDoor to prevent this.
- New features in PE
- See version history of PE.
- NMR
-
NMR (Nuclear Magnetic Resonance)
is an
experimental method
used to determine macromolecular structure.
NMR experiments
yield an ensemble of models, in contrast to the single "best fit" model
yielded by most crystallographic X-ray diffraction experiments.
Differences between models may
represent actual thermal motion in aqueous solution, or a lack of
information adequate to determine the conformation.
All models fit the data well, and the first model is usually not the
most representative of the ensemble.
In some cases, an "energy-minimized" average model is deposited at the
Protein Data Bank.
An example is 2BBN, a 21-model NMR ensemble of calmodulin binding
a peptide from myosin light-chain kinase, accompanied by 2BBM,
a minimized average structure.
(A simple average has unrealistic covalent bond lengths
and angles, so these are adjusted by energy minimization software.)
The
PE Site Map
provides a link to
OLDERADO, which informs you which model is most representative
(closest to the average) of the ensemble.
(For an introduction to NMR, see
Nature of 3D Structural Data.)
PE can display and facilitate analysis of ensembles of models from NMR
experiments. See
multiple models and
animations.
See also
quality of the molecular model,
the NMR format for PDB files
and About Protein Structure.
- NMR format for PDB files.
-
Multiple models can be manipulated independently in
PE if they are in the NMR PDB format. This is standard
PDB format plus special records (lines) in the PDB
file to delimit the models.
The
ATOM records for each model must begin with a line "MODEL N",
where N is the model number (beginning with one for the first model
and going up), and end with a line "ENDMDL". The N in "MODEL N" should
line up with the element symbol column. For a small example,
see 1TOS,
a 3-model PDB file for a 10 amino acid peptide.
See also NMR.
- Noncovalent bonds
- Noncovalent bonds include (from weaker to stronger)
van der Waals interactions,
hydrogen bonds, and
salt bridges.
The
cation-pi interaction is also quite important in protein
folding and stability. PE's QuickViews
provides an overview of noncovalent bonds to any selected moiety with its
DISPLAY Contacts option.
Cation-pi interactions are not shown there, so be sure to also use
DISPLAY Cation-pi.
DISPLAY Salt Br. will show the salt bridge subset
of noncovalent interactions. Within-backbone hydrogen bonds can be
shown as rods using
DISPLAY HBonds.
Advanced Explorer provides more flexible interfaces
for visualizing cation-pi interactions and salt bridges, enabling you to
include ligands, and vary the distance criteria.
Finally, in Advanced Explorer you will find a link
to the Noncovalent Bond Finder. This is useful for a very detailed,
bond-by-bond look at the noncovalent bonds to a selected moiety.
Beware that with ordinary PDB files, you will not see the noncovalent
bonds between neighboring molecules in a protein crystal --
see Crystal Contacts
(also available within PE by using the Mol. Info. link).
- Nuclear Magnetic Resonance
-
See
NMR.
-
Numbers (total counts) of atoms, bonds (covalent and hydrogen), chains, residues,
disulfide bonds, helices/strands/turns
- Click the link Show counts below the
Message Box to display the total
counts for the molecule currently loaded.
- Atoms:
The first number reported in the
message box
is the number of atoms in protein or nucleic acid chains.
The number in (parentheses) is the number of hetero
atoms. The sum of these two is the total number of atoms.
Remember that for most PDB files resulting from X-ray crystallography,
you should multiply by two to estimate the total atoms including
hydrogens.
See also selected atom count.
- Bonds (covalent):
Covalent bonds are usually determined by Chime. (CONECT
records in the PDB file [see
PDB file format] are ignored, except
for certain special cases.) Chime assigns covalent bonds
to any two atoms having a distance from each other of
less than 1.9 Å. Here is
detailed information about bonds.
- Chains:
For the definition of "chain" see
chains.
The number of chains is reported in
the Sequences display
(available from PE Site Map).
(The number of chains reported by Chime's "show info" command
is usually incorrect, and so is hidden in
PE.)
- Hydrogen bonds:
See hydrogen bonds.
- Residues:
Residues are called "groups" in Chime. The first number listed after
"Number of Groups" is the number of amino acid plus nucleotide residues.
The number in (parentheses) is the number of hetero
residues.
- Disulfide bonds:Again, Chime assigns disulfide bonds
based on proximities of cysteine sulfur atoms (any within 3 Å
of each other are deemed disulfide bonded --
SSBOND records in the PDB file are ignored.)
The "Number of Bridges" is correct for single-model (most X-ray) files,
but might be incorrect (too high) if multiple positions (coordinate sets) are given
for some cysteine sidechains. It is incorrect for NMR ensembles of models,
because of a bug that assigns bonds between, as well as within, models.
See also disulfide bonds.
- Helices/Strands/Turns:
For information on the methods used by Chime to assign secondary structure,
in QuickViews do COLOR Structure, and read the
help in the middle frame.
Top A B C D E F
G H I J K L M
N O P Q R S T
U V W X Y Z
Close
- Occupancy (crystallographic)
- Please see temperature.
- Oligomers
- Specific oligomers and complete virus capsids
can be obtained with the link to
Probable Quaternary Structures in the External Resources
window
(accessed via PE Site Map).
- One chain
- You can hide all but one chain
in QuickViews by using SELECT Chain X
(where X is the chain that interests you), then
DISPLAY Only.
Methods for eliminating some of the chains from your
PDB file,
or getting a PDB file containing a single chain,
are explained in the link to Fewer or Single Chains
in the External Resources Window
(accessed via PE Site Map).
- One-Hour Tour
- The
1-Hour Tour (formerly called the QuickTour) is the best way for beginners to become familiar with
PE. It is available from a link on the
FrontDoor, or from links on the
FirstView page.
Top A B C D E F
G H I J K L M
N O P Q R S T
U V W X Y Z
Close
- Papers about PE or protein structure
- See Literature about PE
or Protein Structure Literature.
- PDB
- PDB stands for
Protein Data Bank, the sole international repository
of all published three-dimensional macromolecular structure data
(see
history of the Protein Data Bank).
"PDB terms" include:
- PDB identification code: Each molecular structure published
at the PDB is assigned a unique four-character code. The first character
must be a numeral; the last three characters can be either letters
or numerals. Examples: 1d66 (Gal 4 complexed to DNA), 1hho (oxyhemoglobin),
1bl8 (potassium channel).
- PDB file: The data file that specifies the positions in
space of every atom in a molecule. The generic name for such a file
is an atomic coordinate file. If the file is in PDB format,
the filename should end with .pdb to be widely recognizable,
including by servers. See also Axes, coordinate
and PDB Files, Downloading and Saving.
- PDB format: One of several file formats for
atomic coordinate files. The PDB format is old, ambiguous, and
inadequate, but is still the most widely used format because all
relevant software can read it. An newer and more flexible
alternative format, agreed upon
by the International Union of Crystallographers, is mmCIF
(macromolecular crystallographic information format). Although mmCIF
is offered by the PDB, it is not in wide use. Chime
cannot read mmCIF, but RasMol (version 2.7
and later) can.
Here is a
short overview of the PDB format.
The official format specification is available from the
Protein Data Bank under the FILE FORMATS link.
- PDB Files, Downloading and Saving
-
You can save to your hard disk any molecule you see in
PE (or Chime
on any Chime website).
Once you see the molecule in
PE, click on "MDL" below the molecule (bottom right corner),
and pick File, Save Molecule As.
Sources of PDB files are listed on PE's
FrontDoor.
See also the definition of PDB Files.
PDB files that have been saved to your local hard disk
can be loaded into PE.
- PE
- See Protein Explorer.
- Pedagogy.
- See lesson plans.
- Peptide bonds (cis, trans).
-
Peptide bonds are usually planar
(consult any biochemistry text), and
most have the main chain alpha carbons attached in a "trans" conformation to minimize
steric clashes (omega angle 180 degrees).
On average, only one peptide bond in 1,000 adopts a "cis" conformation
(omega 0 degrees), unless
one of the amino acids forming the peptide bond
is proline. In the latter case, the frequency is one cis bond out of four.
Authors of
PDB files may designate cis peptide bonds in CISPEP
records, in which case they are identified on the
Features of the Molecule
control panel.
- pI
- See isoelectric point.
- Powerpoint (registered trademark of
Microsoft).
-
-
A still snapshot can be copied from
PE
and pasted directly into
a PowerPoint slide. See saving images.
-
If you want to rotate, move, or change
the image during the presentation, there are
three solutions:
- The recommended
solution is to run both
PE
and PowerPoint at the same time. When you get
to the point in your presentation where you want to show and rotate the
molecule, simply pop the PE window in front. To return to PowerPoint,
pop its window in front. This method has the advantage that you can do more
than simply rotate the molecule -- you have the full power of
PE available. Also, the molecule can fill a large
part of the screen.
How do I "pop the PE window in front"?
- Windows: use Alt-Tab to select the
PE window, and then again to return to your Slide Show. (This works while you are
in SlideShow mode of Powerpoint.)
- Windows Taskbar: This method is an alternative to the previous
one. The Windows Taskbar will be hidden in SlideShow mode
unless (before starting your show) you check "Autohide" in
Taskbar Properties (right click on a blank area of the Taskbar to get
the menu with Properties). Then moving the mouse to the bottom of the screen
while showing your slides will pop-up the taskbar in front of the slide. This
enables you to pop the PE window in front.
- Another solution is to insert a hyperlink in a PowerPoint slide
that starts PE and automatically displays the molecule of interest.
This is mostly a convenience in using the previous approach, since
(in Windows at least) when you click the hyperlink in your slide, PE
starts up but then automatically is pushed into the background, behind
the slideshow! So you still have to use one of the above methods to
pop the PE window back in front of the slideshow.
- A third solution is to
create an animated GIF file, and import it
directly into PowerPoint. The advantage is that it is part of your PowerPoint
presentation, and you don't have to run
PE
in the background.
(Animated GIF files can
also be displayed in web browsers -- here is an
example.)
The disadvantages are that the only movement possible
is the one you animated, typically rotation, and that the image may be smaller
than can easily be achieved directly in
PE. A smoothly rotating square image 350 pixels on a side
can easily
exceed several megabytes. Some versions of PowerPoint produce jumpy, irregular
animations, especially with large files. To see if your result is optimal,
compare it with the
appearance of the same animated GIF opened in a web browser.
- Animated GIF files can be imported
directly into PowerPoint 2000
(but not PowerPoint 97): Insert, Picture, From File. Note: dragging the
GIF file and dropping it onto the slide will NOT preserve the animation.
The animation works
only when you show the slideshow (Slide Show, View Show), not while
you are composing the slide.
If you have PowerPoint 97 (Help, About), you can either upgrade to
PowerPoint 2000, or purchase a program to
convert animated GIF files
to AVI movie files.
- For methods of creating animated GIF files, see
Animations.
- Preferences
- Click the link Preferences below the
message box to see the preference settings.
Preferences are remembered between
PE sessions. They are specific to the computer upon which they are set
(and to the person, if multiple personal profiles have been created
in the web browser). Preferences are saved as
cookies.
- Prerequisites
- See Starting PE.
- Presentations
-
- To include images from PE in PowerPoint,
please see PowerPoint.
- Support for authoring molecular tutorial
presentations in PE is under
development.
Examples demonstrating the concept of presentations in PE are available.
Also under development is a command script
recorder
that will work within PE's QuickViews to capture
the commands generated by menus and buttons, and assist in saving them
to a disk file.
- Detailed instructions are available for
authoring presentations in Chime (not in PE), including a template
that includes all required HTML and
javascript. This older (pre-PE) method
requires learning the RasMol command language.
- Printing publication-quality images.
- Molecular images in
PE are rendered by
Chime, using code developed for
RasMol. In writing RasMol, Roger Sayle made
an excellent compromise between image quality and speed of interactive rotation
of the image. As a result, the images are less satisfactory for
publication (see limitations).
(Most published macromolecular images are generated
with MolScript, see molvisindex.org
under freeware.) Often, however, satisfactory images can be obtained
for publication by using the largest screen resolution available (e.g.
1600 x 1200 pixels) together with PE,
and then saving the image.
Here are some
publications with figures made by PE.
- Probable Quaternary Structures (PQS)
- Specific oligomers and complete virus capsids
can be obtained via PE's
link to
Probable Quaternary Structures in the
External Resources Window
(accessed via PE Site Map).
This document also provides an introduction to the methods employed
and a number of examples.
In case there is more than one copy of the molecule
in the PDB file due to
crystal contacts, a single copy
can be obtained from PQS.
The
European Bioinformatics
Institute provides the
PQS service.
- Problems
-
- Project folders.
- Project folders are a feature for advanced users who wish to write
command scripts.
Project folders (disk directories designated to PE)
contain PDB (.pdb) and script (.spt) files that can be loaded
and executed in PE.
For more information,
click the Set Project Folder link below the
message box.
- Protein Data Bank
- See PDB.
- Protein Explorer (PE)
- Freeware for visual exploration of macromolecular 3D structure.
A user interface that makes the power of
Chime accessible to students, educators, and
occasional users.
Easier to use, and much more powerful
than
RasMol.
Independently described as an "impressive integrated knowledge base".
Accessible at
www.proteinexplorer.org.
- Protein structure
- See
Nature of 3-D Structural Data,
Protein Structure Literature,
and
Protein Structure Bioinformatics Resources.
- Proteome, proteomics
- The proteome is "an organism's complete set of proteins
in every form they assume"
(
PROTEOMICS: High-Speed Biologists Search for Gold in Proteins,
by R. F. Service, Science 294:2074, Dec 7, 2001).
Proteomics, of course, is the study of proteomes.
The number of proteins in an organism's proteome is believed to
be roughly an order of magnitude larger than the number of genes
in that organism's genome. Proteomics is well funded by
pharmaceutical venture capital in the expectation of identifying
drug-target proteins. Key methods in proteomics involve
identification, particularly in diseased vs. normal states
(two-dimensional gel electrophoresis, mass spectrometry), protein
interactions (yeast-two-hybrid, protein microarray chips),
and structure determination (high-throughput crystallography).
For a good overview, see
the above-cited article, and others in the proteomics news focus
of that issue.
- Publications about PE
- See Literature about PE.
- Publication-quality images, printing.
- See Printing.
Top A B C D E F
G H I J K L M
N O P Q R S T
U V W X Y Z
Close
- Quality of the molecular model
- The molecular models published in
PDB files
for
X-ray crystallography vary widely in quality, and rarely they are
grossly incorrect.
Generally, model quality is indicated by the
resolution of the model, the
R value, and especially the
Free R.
Some useful information on model quality,
including the
Ramachandran plots,
can be
obtained from PDBReports, linked to Model Quality in the
External Resources Window
(accessed via PE Site Map).
Also linked there is All-atom contact analysis, a
new method for finding
and correcting errors in crystallographic models.
Generally, crystallographic models are reliable in most details when
they have resolutions of 2.0 Å
or better, R values of 0.20 or less, and R free values of 0.25 or less.
However, new and important structural insights are often provided by models
with much lower resolution.
NMR models are generally somewhat less reliable
than crystallographic models because the method yields less detailed
information. For NMR, there are no widely reported global error estimates
equivalent to the crystallographic R value
and
free R.
Unlike with crystallographic results,
it is not possible to distinguish reliable from unreliable NMR models
from information included in the PDB files.
Laskowski has provided an outstandingly
clear and succinct overview of how to assess model quality.
For examples of published crystallographic errors, see
Laskowski, and
Kleywegt, 2000, and Kleywegt and Brünger, 1996.
- Quaternary Structures
- Specific oligomers and complete virus capsids
can be obtained with the link to
Probable Quaternary Structures in the
External Resources Window
(accessed via PE Site Map).
- QuickTour
- The
1-Hour Tour (formerly called the QuickTour) is the best way for beginners to become familiar with
PE. It is available from a link on the
FrontDoor, or from links on the
FirstView page.
-
QuickViews
- The QuickViews control panel
is the heart of the user-friendly
exploration power
in PE. QuickViews enables you to explore extensively
without
learning any of Chime's
command language.
Usually you arrive at QuickViews after FirstView and then Features of the
Molecule.
To get to QuickViews from another control panel, look for the link
PE Site Map
in the current
control panel. You may have to scroll
the control panel up or down to find it.
There is also a
command to PE that will take
you to QuickViews:
enter the command .q
("q" preceded by a period).
- Quotations about PE
- See Literature about PE.
Top A B C D E F
G H I J K L M
N O P Q R S T
U V W X Y Z
Close
- R value
- The R value is used to assess progress in the refinement of a model
from X-ray crystallographic data, and can be used as one factor in
evaluating the quality of a model
(see Free R).
R is a measure of error between the
observed intensities from the diffraction pattern and the predicted
intensities that are calculated from the model.
R values of 0.20 or less are taken as evidence that the model
is reliable.
As a rule of thumb, models with R values substantially exceeding
(resolution/10) should be treated with caution.
Thus, if the resolution of a model
is 2.5 Å, that model's R value should not exceed 0.25.
Completely erroneous models (e.g. random models) give R values
of 0.40 to 0.60.
However, R values themselves must be treated with caution.
Unlike the Free R,
acceptable R values can be achieved despite serious errors
in the model, as demonstrated
unequivocally by Kleywegt & Brünger.
One famous pitfall that can result in a misleading R value is the addition
of substantially more than one water molecule per amino acid.
See also
Quality of the moleculer model,
resolution, the excellent overview by
Laskowski,
and resources by Gale Rhodes.
- Ramachandran plots
- As explained in any biochemistry textbook, the main chain
(phi and psi) dihedral angles of amino acids in proteins
are usually restrained to certain favorable
values by steric
interactions.
The distribution of main chain dihedral angles in a protein model can be visualized
in a Ramachandran plot, where the favorable values are designated
as "core regions". Models of proteins having substantial numbers of
residues
(except for glycines, prolines, and D amino acids)
falling outside the sterically favorable core regions are suspect.
Atomic resolution models (resolution 1.2 Å or better) of good quality
have more than 90% their residues in the core regions; models with resolutions
of 3.0-4.0 Å generally have about 70% of their residues in the core
regions, reflecting the more numerous inaccuracies in such models.
See Quality of the molecular model.
- Range of residues, selecting, coloring, etc.
- To select a range of residues from the sequence, open the
PE Site Map,
and there open
Seq3D.
In the Seq3D window, check Show & select range,
then click on the first and last residues of the desired range.
The residues are now selected, and you can return to
QuickViews to change their DISPLAY
or COLOR scheme. (If you wish to select more than one range at a time,
in Seq3D, check Accumulate selections.)
- RasMol
- The molecular graphics in PE come from RasMol,
a brilliant, stand-alone molecular visualization program written by Roger A. Sayle
(see his
personal history of RasMol).
RasMol is freeware and open-source, thanks to the generosity of its
author. Because of that, the RasMol-derivative
Chime is free, and because of that (and thanks
to the National Science Foundation), PE is free.
RasMol is used by millions of people. RasMol and extensive documentation
are available from the
RasMol Home Page. PE is
much easier to use, and more
powerful than RasMol.
- Reichsman, Frieda
- Suggested some important user-friendliness design features of
PE and its Tutorial.
Author of content for several major topics in
Biochemistry in 3D
for Lehninger's Principles of Biochemistry.
Founder of Molecules In Motion
where some additional high-quality Chime tutorials are available.
- Requirements for PE
- See Starting PE.
- Resizing PE's Window
- Resizing PE's window usually causes PE to stop working or crash.
This is due to an interaction between the
Chime
plugin and the web browser that is beyond our control.
Therefore, the size of PE's window must be set before the session starts.
This is done with a menu on PE's
FrontDoor.
For details, please see Window
Size Control in PE.
- Resolution.
- X-ray crystallographic models are characterized by a
"Resolution" value displayed at PE's Features
of the Molecule control panel.
(Do not confuse "Resolution" with
R Value
or
Free R.)
Small numeric values for resolution mean small uncertainty, hence good
resolution; larger values mean poor resolution. For example, 5.0 Å is rather
poor resolution for a protein, such that the backbone fold will generally
be clear but the sidechains will generally be unresolved.
2.5 Å resolves more atomic positions with
greater certainty, including the positions of many sidechains.
1.2 Å is high (truly "atomic") resolution for a protein, where not only sidechains but some
hydrogen atoms can be discerned.
On average, the uncertainty of the position of an atom is roughly one fifth
to one tenth of the resolution for high-quality data (R value 0.20 or
less, succinctly explained in Rhodes).
However, uncertainty
(disorder)
typically varies from region to region of the
model, and is reflected in the temperature value
assigned to each atom.
In
NMR results, uncertainty in the position of an atom is represented
by the range of positions of that atom in the ensemble of models.
- Rhodes, Gale
- Author of
Crystallography Made Crystal Clear, second edition, 1999, a very
readable introduction highly recommended for beginners interested
in crystallography. See
Gale Rhodes' personal website, which has links to many excellent
tutorials on molecular visualization and modeling, especially
with the use of
DeepView.
- Rotation troubleshooting.
- Dragging on the molecule with the mouse should rotate it. If the molecule
fails to rotate, but instead slides without rotating, Netscape and Chime
have become
corrupted. This is not your fault. The solution is simply to close all Netscape
windows (or on Macintosh, File, Quit Netscape). Then restart Netscape and
start a new PE session. We hope this doesn't happen to you
when you're projecting PE to illustrate a talk -- but it has occasionally
happened to us in that situation. Just smile, explain that PE, Netscape and
Chime are all under development and hence are not totally bug-free, and proceed by quitting
and restarting Netscape. It won't happen again in the same talk, usually.
Top A B C D E F
G H I J K L M
N O P Q R S T
U V W X Y Z
Close
- Salt bridges
- Salt bridges occur between amino acid side-chains
with opposite positive or negative full-electron charges, generally
when they are 4 Å or less apart (Jeffrey, p. 192).
The energetic significance of such complementary charge pairs
is a complex function of the local environment and cannot
be predicted by Protein Explorer.
Putative salt bridges can be displayed by Protein Explorer in
QuickViews
(DISPLAY, Salt Br.), where they are explained in the center help frame.
Further information can be found in Advanced Explorer
under Cation-Pi/Salt Bridges, where there is an
Introduction, Gallery & Tutorial.
- Saving, from PE:
-
- Saving images from
PE.
(See also Printing Publication Quality Images.)
- Still "snapshot" images are easy to save from PE. Several
methods are given below. Once you have saved the still image,
you can paste it
into any graphics program (e.g. Windows Paint),
PowerPoint, or Word. From a graphics
program, an image saved in .jpg (jpeg) format can be displayed
directly in a web page since web browsers understand this format.
The only image formats understood by most web browsers are .jpg
and .gif. Netscape can save an image from the clipboard
to a .jpg file -- see below.
Images saved by the methods listed below are static -- they cannot
be rotated.
If you want to save the state of your PE session,
so you can return to the same image of the molecule easily later,
see scripts, saving.
- Copying the image to the clipboard directly from Chime.
This method is recommended. First, start a PE session in a
window
sized so that the Chime image will be the size you desire.
After you get the desired image of your molecule,
click on the
MDL below the molecular image to pop up Chime's menu. Click on Edit,
Copy. This copies the image to the clipboard.
Now, change to the program into which you wish to paste
the image (see above and below), and use Edit, Paste to
paste in the image from the (invisible) clipboard.
- Using Netscape to save a .jpg file from the clipboard.
Perhaps the easiest (and free) method for saving the image
from the clipboard to a .jpg format disk file is with Netscape.
After you have completed the previous step (putting the image in the
clipboard), in Netscape, File, New, Blank page. (This opens
Netscape Composer.) Now Edit, Paste. Your image will appear.
(I can't see any way to crop it with Netscape Composer.)
Right click on the image, Save image as, and you will be offered
to save the image as a .jpg file to a location on your hard disk
that you specify. To confirm that the image is on the disk and
viewable in Netscape (e.g. for putting on a web server),
in Netscape, File, Open Page, Choose File.
- Macintoshes only: saving a selected portion of the screen
directly to a file.
Get the image you want in PE, in the foreground.
Hold down Command (Apple) plus Shift, and press the "4" key. Now,
use your mouse to click and drag a rectangle around what you want
to save. When you release the mouse, the image will be saved directly
to a PICT format disk file. As mentioned above, this will need to be
converted into .jpg (jpeg) format if you want do display it
in a web browser. Shareware graphics conversion programs are available
to do this.
- Windows only: copying the active window to the clipboard. Windows
does not provide a built-in method to save a screenshot
directly to a file. However, Alt-PrtSc (hold down the Alt key, then press
the Print Screen key) copies the active window to the clipboard. If PE
is the active window, it will copy the entire PE window. You can then
paste the image into any graphics application, or save it using Netscape
Composer
(see above).
Below are given methods for cropping this image.
Copying the image directly from Chime (see above) may avoid
the need to crop the edges of the image.
- Windows only: cropping an image (free method). Graphics
programs typically provide a way to crop the edges off of an image
so you keep only the portion in the center that you want.
In Windows, this can be done with the free program Paint, that comes
with Windows. (Start, Programs, Accessories, Paint.) In Paint,
either paste the image from the clipboard (Edit, Paste) or read it
in from a disk file (File, Open). In the toolbar at the left, press
the Select tool button (dotted rectangle). With the mouse, click and drag
to put a rectangle around the portion of the image you wish to keep.
Cropping in Paint seems problematic, so here is an easy workaround.
With the desired portion of the image selected in the dotted rectangle,
Edit, Copy. This places the selected portion of the image on the clipboard,
ready to paste into another application. You can now use the Netscape Composer method
(above) to save the cropped image to a .jpg file.
- Windows only: saving a selected portion of the screen to
a .jpg file. An excellent
and inexpensive
shareware utility for saving an arbitrary rectangle from the screen
into a .jpg file
is PrintKey.
- If you know useful alternative methods or freeware (e.g. for
cropping the screenshot in Windows), please email details
to me.
- Sayle, Roger,
- see RasMol.
- Scripts, of commands.
- Chime has an extensive
command language,
a superset of RasMol's command language. PE's menus and
buttons generate commands and send them to Chime (using
javascript).
The commands can be seen in PE's message box.
Scripts of commands can be saved in a plain text file, and run in PE.
See the link Set Project Folder beneath PE's message box
for details on running command scripts in PE.
- Scripts, saving.
- Command scripts can be saved automatically,
then played back in order to restore the currently displayed image.
Thus restored, the image is displayed in PE and
can be rotated and modified, e.g. with QuickViews.
The best way to play back a command script file is to
set a project folder.
At present, the only method to save a command script is one built into Chime. Click
on the MDL frank to the lower right of the molecular image, thereby
opening Chime's menu, then Edit, Copy Chime Script. This places the script
on the clipboard, from which it can be pasted into any text editor
(WordPad in Windows, or BBEdit on Macintosh). The script must be saved
as plain text (but with a filename ending .spt)
in order to run in Chime. These scripts
are unnecessarily long and may take an unnecessarily long time to
produce the image -- see
Shortening Scripts Saved from RasMol or Chime. These scripts
are generated by a mechanism inherited from RasMol which contains a few
bugs, and which does not know about surfaces. Hence, they will not
generate surfaces, and commands must be inserted manually to restore
surfaces.
The best way to play back a command script file is to
set a project folder.
In order to overcome the limitations of scripts saved automatically
from Chime, a script recorder is under development.
See Presentations in PE.
- Screenshots
- It is easy to save a screenshot (snapshot of the screen)
for your molecule. See
Saving images from PE.
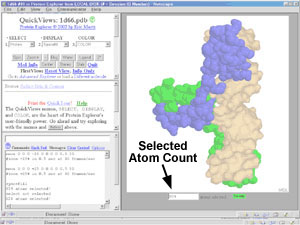 Selected atom count
- Chime's rendering (display) and coloring commands always work on the
currently selected atoms. Atoms can be selected with the
QuickViews SELECT menu, or with
commands.
After each selection operation, the number of atoms selected is reported in
the message box. It is also displayed in a slot below the image of the
molecule (except in Comparator).
- Selection methods
-
Here are some tips on how to select portions of your molecule.
-
Choose SELECT, >HELP< in QuickViews.
See also Selected atom count.
- To select one ligand among many by clicking on it with the mouse,
at
QuickViews, SELECT Clicked.
- To select one or a few atoms by clicking on them with the mouse,
at
QuickViews, SELECT Clicked.
- To select an arbitrary subset of the chains by clicking on them
with the mouse,
at
QuickViews, SELECT Clicked.
The subset of atoms you select by clicking is automatically saved
when you press Stop (stop selecting by clicking). Later,
if you choose SELECT Clicked,
a new option will appear to re-select that subset.
- To add to (rather than replacing) the selected atoms with the
next SELECT menu choice,
in the top QuickViews frame,
scroll down to Quickviews Boolean
Options, and use the pull-down
menu there to change the selection logic. Other options there are
subtract from, or "and", which selects atoms in common to
the new and prior selections.
- To select a range of residues from the sequence,
choose DISPLAY Sequences, and then choose Seq3D.
(This is also available
from the PE Site Map).
In the Seq3D window, check Show & select range,
then click on the first and last residues defining the range.
You may like to save this subset for later re-selection (see below).
- To select all cases of one type of amino acid
or nucleotide (e.g. all Trp's or all U's), use
Chime's Menu.
- Subsets of atoms you have selected can be saved
by choosing SELECT Saved. There, you give each
saved set a name of your choice.
When the selection process is complicated, saving the result
avoids having to repeat the process later in the session.
By again choosing
SELECT Saved, there will be a menu allowing you to
re-select any previously saved set. Saved sets last only
until the end of the session, or until you load a different molecule.
- Finally, you can enter commands. The best
way to learn commands is to watch the commands PE
sends to Chime after you use the SELECT
menu in QuickViews. Here are a few common examples:
- select :a to select chain A.
- select :a,:c,:e to select chains A, C, and E (comma is the same as "or").
- select 22-47:a to select residues 22-47 in chains A.
- select lys,arg to select all lysines and arginines
- select calcium or magnesium to select all Ca or Mg atoms.
- select oxygen and (asn or gln) and sidechain
to select oxygen atoms in Asn or Gln sidechains.
Also available is a
comprehensive overview of selection commands.
Commands can also be used to color or
change the display rendering.
- Seq3D
- Seq3D is a clickable sequence display that can be used to
highlight the locations of particular amino acids in the 3D display.
It can also be used to select arbitrary amino acids from the sequence
listing (using the option to "Accumulate Selections"), or to
highlight and select a range of amino acids (using the option
"Show and select range", then clicking on the ends of the range).
Seq3D is accessed from the
PE Site Map.
For a tour of how to use it, see the 1-Hour Tour
including the section "Beyond the 1-Hour Tour".
- Sequence alignments
- See evolution.
- Sequences
- Amino acid and nucleotide sequences can be displayed using
QuickViews DISPLAY Sequences,
or with the PE Site Map. Both methods offer
a verbose display of sequences, as well as the Seq3D,
where you can highlight and select residues, or ranges of residues,
by clicking on the sequence.
- SGI
- Protein Explorer works well in a
Microsoft Windows window
on SGI/Irix supported by Citrix Metaframe.
- Show counts
- A link below PE's Message Box
that displays information there.
See Numbers.
- Simplified PE?
- Some educators have inquired about a "simplified" PE.
While PE itself has not been simplified, something in that vein has been
provided in MolUSc,
but it is available only in French (any volunteers to translate it?).
MolUSc is a technically well-documented visualization interface,
but without many of the capabilities and the
integrated knowledge base offered in PE.
- Single chains
- Methods for eliminating some, or all but one, of the chains from your PDB file
are explained in the link to Fewer or Single Chains
in the External Resources Window
(accessed via PE Site Map).
- Site Map in PE
- PE's Site Map is opened by a link in every
control panel in PE. You may have to scroll
up or down to find the link to the PE Site Map -- it is usually near the
cluster of buttons (Spin, Zoom, Water buttons etc.); however, in FirstView,
it is at the bottom of the control panel. PE's Site Map has links
enabling you to jump to any other control panel, as well as Sequences
and External Resources. Thus it provides an overview
of all control panels and PE resources, and enables easy navigation within PE.
- Size of PE's Window
- Please see Window Size.
- Slow operations, warnings
- Certain operations can be very slow (minutes)
if performed when a large
subset of atoms is selected in a large molecule.
These include toggling the display of water or ligand,
DISPLAY Vines,
displaying
secondary structure with the 2o button, or using
COLOR Polarity or ACGTU.
If you request an operation that PE predicts
will take more than 12 seconds, you are warned, told that
it will be much faster if you first SELECT All, and you are given
the option to cancel or proceed slowly.
The warning is graded from "slow" to "VERY slow" to "VERY VERY slow"
based on the predicted time to completion.
The slowness of these operations occurs in
Chime's reselection of sets of atoms given
names with the define command, when the sets are large.
This limitation is beyond our control.
For additional technical information, see
Design Features:
Management of Slow Operations.
The relative speed of Chime is measured in your first
session of PE, and saved. You can display it by
entering the command speed.
If you are curious to know the times PE predicts for requested
operations, enter the command speedwatchon.
Mac PPC users only:
We have not been able to get PE's measurement of Chime speed to work
when PE is downloaded on a Mac PPC. In this case, PE asks you whether
you have a G3, G4, or "fast" G4 to estimate Chime's speed. If you prefer,
you can use the speed command to report the measured relative speed
value when running PE on-line from a server (where the measurement works),
and then enter this value for your downloaded copy. To force PE to
re-measure (or re-request) the relative Chime speed, enter the
command speed and you are given the option to erase the present
value. When you start the next PE session, PE will re-determine the
relative speed of Chime on your computer.
- Snapshots
- It is easy to save a snapshot of your molecule. See
Saving images from PE.
- Solvent.
- In general, of course, the major solvent involved both in protein
crystallography and NMR is water. However, in Chime
and therefore in PE, the term "solvent" includes,
in addition to water,
some nonmacromolecular solutes, namely sulfate and phosphate
ions, that may be
incidentally bound to protein.
In PE, all hetero atoms are divided into
ligand and solvent.
For more information about the
definition of "solvent" see "predefined sets" in the
RasMol Reference Manual.
- Specifications for Protein Explorer
-
- Speed, relative, of Chime
- See slow operations.
- Spin control
- By default, the molecule spins at the beginning of a session
to show 3D aspects of the structure. It is particularly important
when illustrating a lecture or seminar to move the molecule often
to help the audience see the 3D structure.
Spinning can be stopped or started at will with
a "Spin" toggle button, present on every
control panel.
(You may have to scroll up or down to find the "Spin" button.)
Whether or not the molecule is spinning at the beginning of a session
is a preference.
Starting with PE 2.2, spinning stops automatically,
without confirmation, after 3 minutes. (This is to avoid spinning in
background sessions, which will degrade computer performance.)
Sometimes it is useful to have spinning continue indefinitely. An example
is an exhibition display where people walk by. To keep spinning going
indefinitely,
enter the
command alias nss (non stop spin).
(Although rarely needed, there is also a command alias nssf
for "non stop spin false".)
- Starting Protein Explorer
-
- State of PE, saving
- Some visualization programs, notably WebLab Viewer Lite
(find it under free software at
molvisindex.org), allow you to save the state, resuming the session
later exactly as you saved it. Unfortunately, Chime
and Protein Explorer don't have this cool capability. It is possible, though,
to save a command script that, when run
in a new PE session, will restore a particular image. Such restored images
can then be rotated, or serve as a starting point for analysis
with the full power of PE. Saving command
scripts is most appropriate for advanced users who are willing to devote
considerable time. They are the basis for
Presentations in Protein Explorer.
- Stereoscopic viewing in three-dimensions
-
Protein Explorer has a [Stereo] button (on every page after FirstView,
near the [Zoom+] and [Bkg] buttons)
that toggles split-image stereo on and off. You can control
whether the images work with convergent (cross-eyed) or divergent (wall-eyed)
viewing in the Preferences.
For instructions on viewing stereo pairs unaided,
see How can I see
the molecule in stereo?
An inexpensive, easy to use, pocket-sized viewer for divergent image
pairs is available from www.pokescope.com.
- Structural Bioinformatics
-
The subset of bioinformatics that concerns
three-dimensional macromolecular structure. Well covered in a
2003 book edited by Bourne and Weissig.
See also About Protein Structure.
- Structural Genomics
-
An international initiative begun around 2000
to develop 3D structural models for the majority
of proteins in genomes using homology modeling.
For details, see the slide on structural
genomics (among the slides on Global Protein
Structure Issues).
- Structure, protein
- See
Nature of 3-D Structural Data
and
Protein Structure Literature.
- Surfaces
- Chime (and hence Protein Explorer)
can display surfaces of selected atoms. These are solvent-accessible surfaces
that represent the contact path of a sphere rolled around the outside of the
cluster of selected atoms.
The probe sphere is, by default, 1.4 Å in radius, the size of a water
molecule. Surfaces are used
in QuickViews DISPLAY Contacts, or DISPLAY Surface.
In Advanced Explorer, the Surfaces page enables
generation of multiple surfaces concurrently. Here, a variety of color
schemes can be applied, including molecular electrostatic
potential or molecular lipophilicity potential. Also, the probe radius
and spacing, the algorithms used for potential calculations, and the
coloring for potentials are adjustable.
Michael L. Connolly has provided a detailed on-line
Review of Molecular Surfaces.
- Synch.
- The [Synch] button appears only in
Protein Comparator.
Moreover, it appears only in Windows; this capability was not implemented
in Chime 2 for the Macintosh. When synchronization is
turned on with this button, and one molecule is rotated with the mouse, the
other molecule will rotate synchronously. In fact, all
mouse-controlled
operations will be synchronized.
Top A B C D E F
G H I J K L M
N O P Q R S T
U V W X Y Z
Close
- Teaching molecular structure.
- See Lesson Plans for Macromolecular Visualization.
- Temperature value (disorder).
-
Uncertainty in the positions of atoms increases with "disorder"
in the protein crystal.
Some regions of the molecule may have higher
average disorder, and others lower average disorder.
Typically, the ends of chains have higher average disorder, and
hence their positions are less certain than are residues in the
core of a tightly packed domain, where disorder is less.
"Disorder" has two components. First, some regions of the molecule
may adopt different conformations in different copies of the molecule,
each molecule's conformation being stable. Second, some regions of every
copy of the molecule may be subject to thermal motion, meaning vibration
about the rest position (Rhodes). Thermal motion
is minimized when the crystal is frozen with liquid nitrogen while
being irradiated.
In the PDB format, each atom is given not
only X, Y, and Z Cartesian coordinates, but two additional values
immediately following called "occupancy" and "temperature factor"
(also known as the "isotropic B value"). If the end of a chain
adopts either of two stable positions with equal probability, each position
has 50% occupancy. The temperature factor is provided to quantitate
the level of thermal motion. However, these two components of disorder
cannot be distinguished with crystal diffraction data alone. Therefore,
the occupancy is often given as 1.0 (100%), while the degree of
"blur" in the electron density map, representing both components
of disorder, is reported in the temperature value.
PE's QuickViews COLOR menu
offers a Temperature color scheme, in which the range of temperatures
is assigned a spectral sequence from blue (low temperature, higher certainty)
to red (higher temperature, higher uncertainty).
Often the very ends of chains, or surface loops, may be so disordered
as to prevent assigning an positions at all, leading to
missing residues.
- Total counts of
atoms, bonds, chains, residues,
disulfide bonds, helices/strands/turns
- See numbers.
- Tour, 1-Hour
- See One-Hour Tour.
- Troubleshooting
-
- Can't get Protein Explorer to show a molecule at all?
See
Troubleshooting your installation.
- Can't rotate the molecule with the mouse? See
rotation troubleshooting.
- The molecule can be rotated with the mouse, but it
slides off center when rotating.
Zoom down. This is explained in
PE's QuickViews,
in the middle frame,
after you click the [Zoom+] button.
- Did your computer get very slow or freeze while you were
using Protein Explorer? See
Freezing.
- Did Netscape or Internet Explorer
completely stop responding, or crash?
See Crashing of Netscape.
- Did you get a javascript error?
See javascript errors.
- Are some residues missing in your molecule?
See missing residues.
- Did you get a "Network error"?
See Network error.
- Finally, see Limitations of PE.
- Tutorial
- PE includes an extensive Tutorial.
- Two molecules at once.
-
See
Protein Comparator
and
docking.
Top A B C D E F
G H I J K L M
N O P Q R S T
U V W X Y Z
Close
- UnDo.
- There is, unfortunately, no "undo" capability. A plan for such
a capability has been formulated for implementation in a future release.
See also
limitations.
- Unit cell, crystallographic.
- This is the smallest portion of a crystal that, when replicated
in three dimensions, makes up the entire crystal. It can be
viewed by
entering the command set unitcell on.
(The background must be black).
See Crystal contacts
and Axes, coordinate.
- Use of PE
- See Visitors.
Top A B C D E F
G H I J K L M
N O P Q R S T
U V W X Y Z
Close
- Validation of molecular model quality
- Please see Quality of the molecular model.
- Version history of PE
-
PE includes the
history of all released versions, which lists the new features
added in each version.
- Virus capsids
- Complete virus capsids
can be obtained with the link to
Probable Quaternary Structures
in the External Resources Window
(accessed via PE Site Map),
provided you have the appropriate virus capsid
PDB file loaded.
- Visitors to PE
- The use of PE is tracked with free meters
from sitemeter.com.
There is one meter at the bottom of the FrontDoor,
and another in a pop-under window invoked when
QuickViews is entered. The former measures total interest, while the latter
measures visitors who actually install Chime and
use PE.
If these meters create any problem for you, please let
me know and I'll
consider other alternatives. See also
network errors.
- Visualization, molecular.
- Strictly speaking, "molecular visualization" means looking
at a structure without changing it, that is, without
performing molecular modeling.
Top A B C D E F
G H I J K L M
N O P Q R S T
U V W X Y Z
Close
- Water
- For protein crystallography, the protein
is crystallized from aqueous solution. In order to preserve the regularity
in the ordered array of crystallized protein molecules, the crystal must
not be dehydrated -- it is kept moist with the mother liquor from which
the crystal formed. Protein crystals are wet and gelatinous.
In fact, they are, on average, about half water.
For NMR, measurements are made while the
protein molecules are in aqueous solution.
Here is more information
about water.
- Web browser
- Please see Browser, Web.
- Window size, controlling PE's
- On the FrontDoor of
PE is a menu labeled Window size for new PE sessions.
For details on controlling PE's window size,
click on that link,
or go directly to Window
Size Control in PE.
- Workshops
-
Workshops and workshop syllabi to train students, faculty,
and researchers in the uses of PE and related resources
are available.
Top A B C D E F
G H I J K L M
N O P Q R S T
U V W X Y Z
Close
- X-ray crystallography
-
X-ray crystallography is the most common
experimental method
for determining
the 3D structures of macromolecules. About 85% of published macromolecular
structures in the Protein Data Bank were determined
by X-ray crystallography.
For a brief introduction to the method, and references to more information,
see
Nature of 3D Structural Data.
Overall, only a few percent of macromolecular structures selected for crystallography
are successfully solved (see the
slide on crystallography among
the
slides on Global Protein Structure Issues).
See also
quality of the molecular model,
temperature value (disorder),
resolution,
R value,
and
free R.
Top A B C D E F
G H I J K L M
N O P Q R S T
U V W X Y Z
Close
Top A B C D E F
G H I J K L M
N O P Q R S T
U V W X Y Z
Close
References Cited